Overview of the ISC-GEM Catalogue version 1.0, 31 Jan 2013
The following cut-off magnitudes were selected prior to the start of the project (Fig. 1) and were dictated by the time constraints and availability of funds:
- 1900-1917: Ms≥7.5 worldwide + smaller shallow events in stable continental areas
- 1918-1959: Ms≥6¼
- 1960-2009: Ms≥5.5
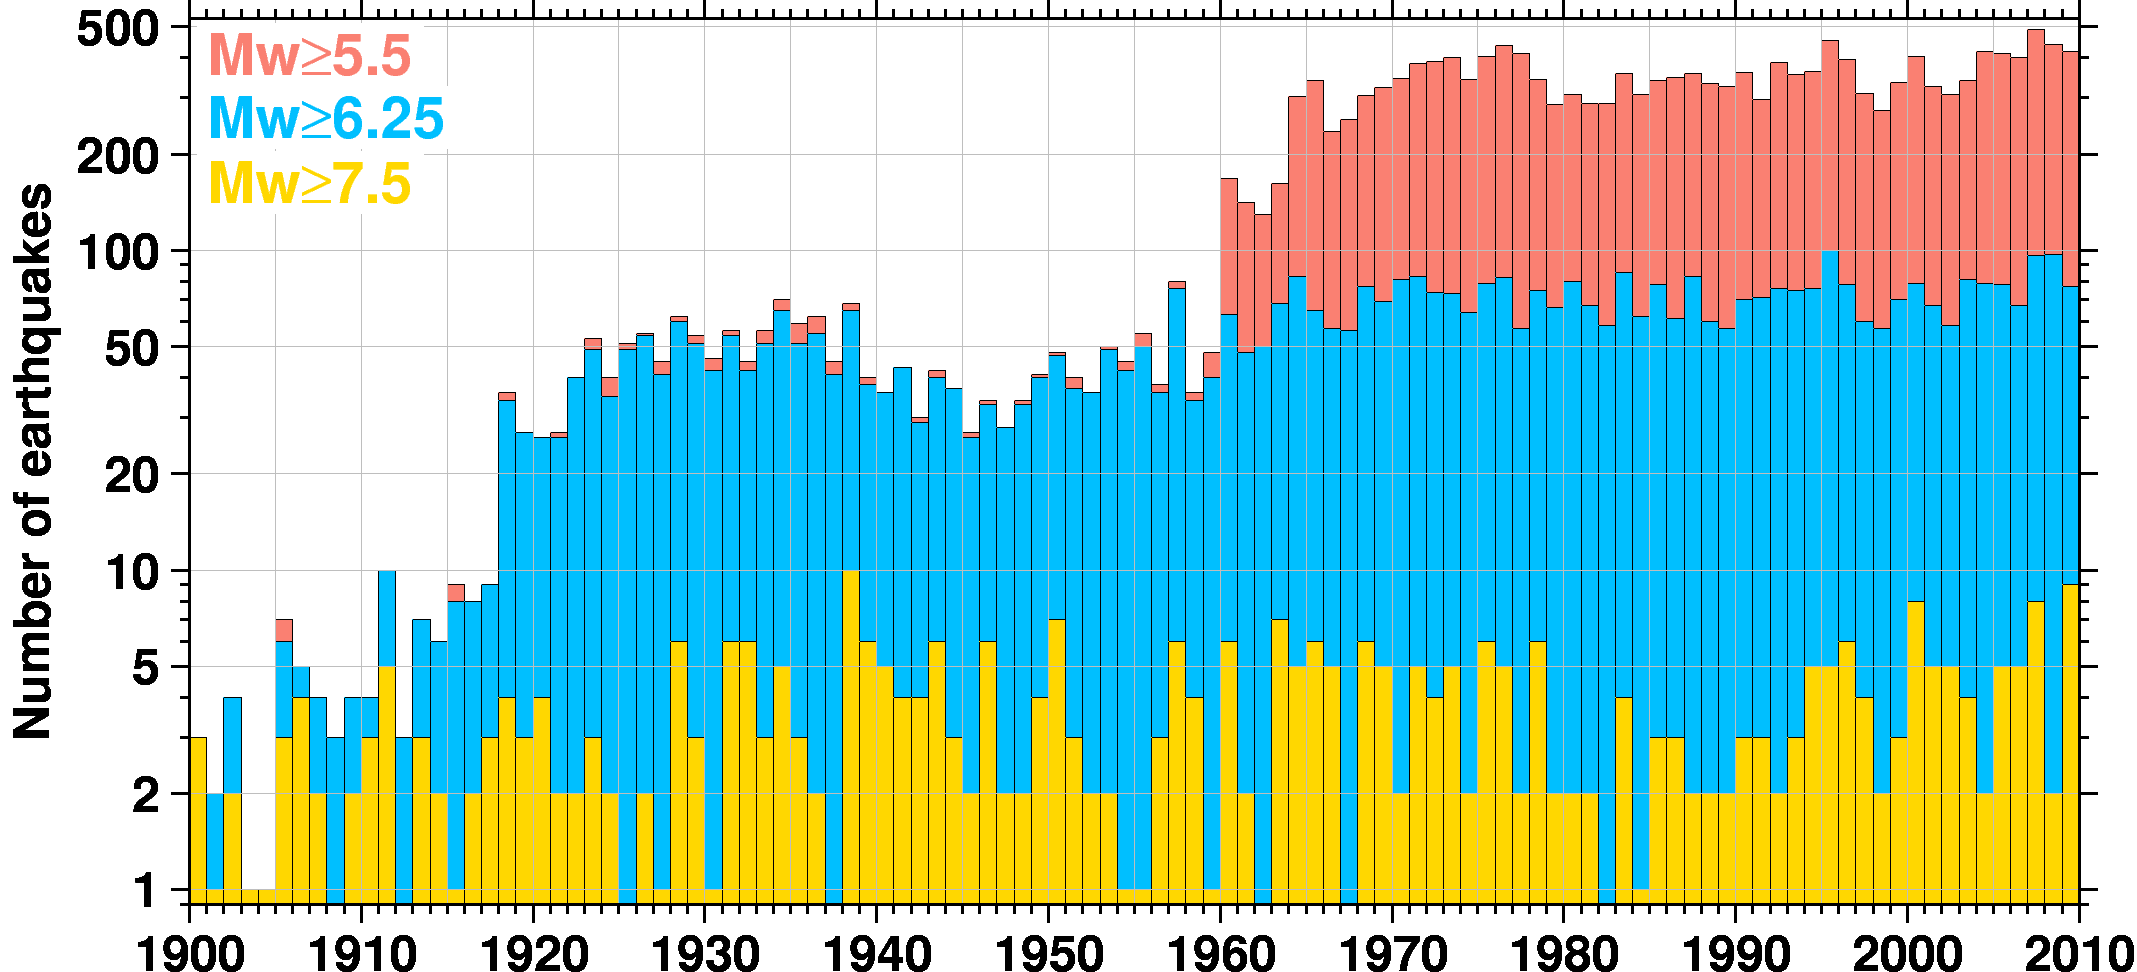 Figure 1. Global earthquake number timeline demonstrating the effect of different cut-off magnitudes over the 110 year period; M indicates a direct or a proxy value of Mw
This Catalogue is unique because it contains homogeneous locations and magnitudes with estimates of uncertainty for the entire period 1900-2009 prepared, where possible, using uniform techniques. The Catalogue features:
- 110 years of ~20,000 re-located earthquake hypocentres & uncertainties, using original arrival time data and the same technique and velocity model described below;
- magnitudes expressed in Mw scale with uncertainties, based on seismic moment, where possible; proxy Mw were used in all other cases based on the newly developed empirical relationship with Ms and mb.
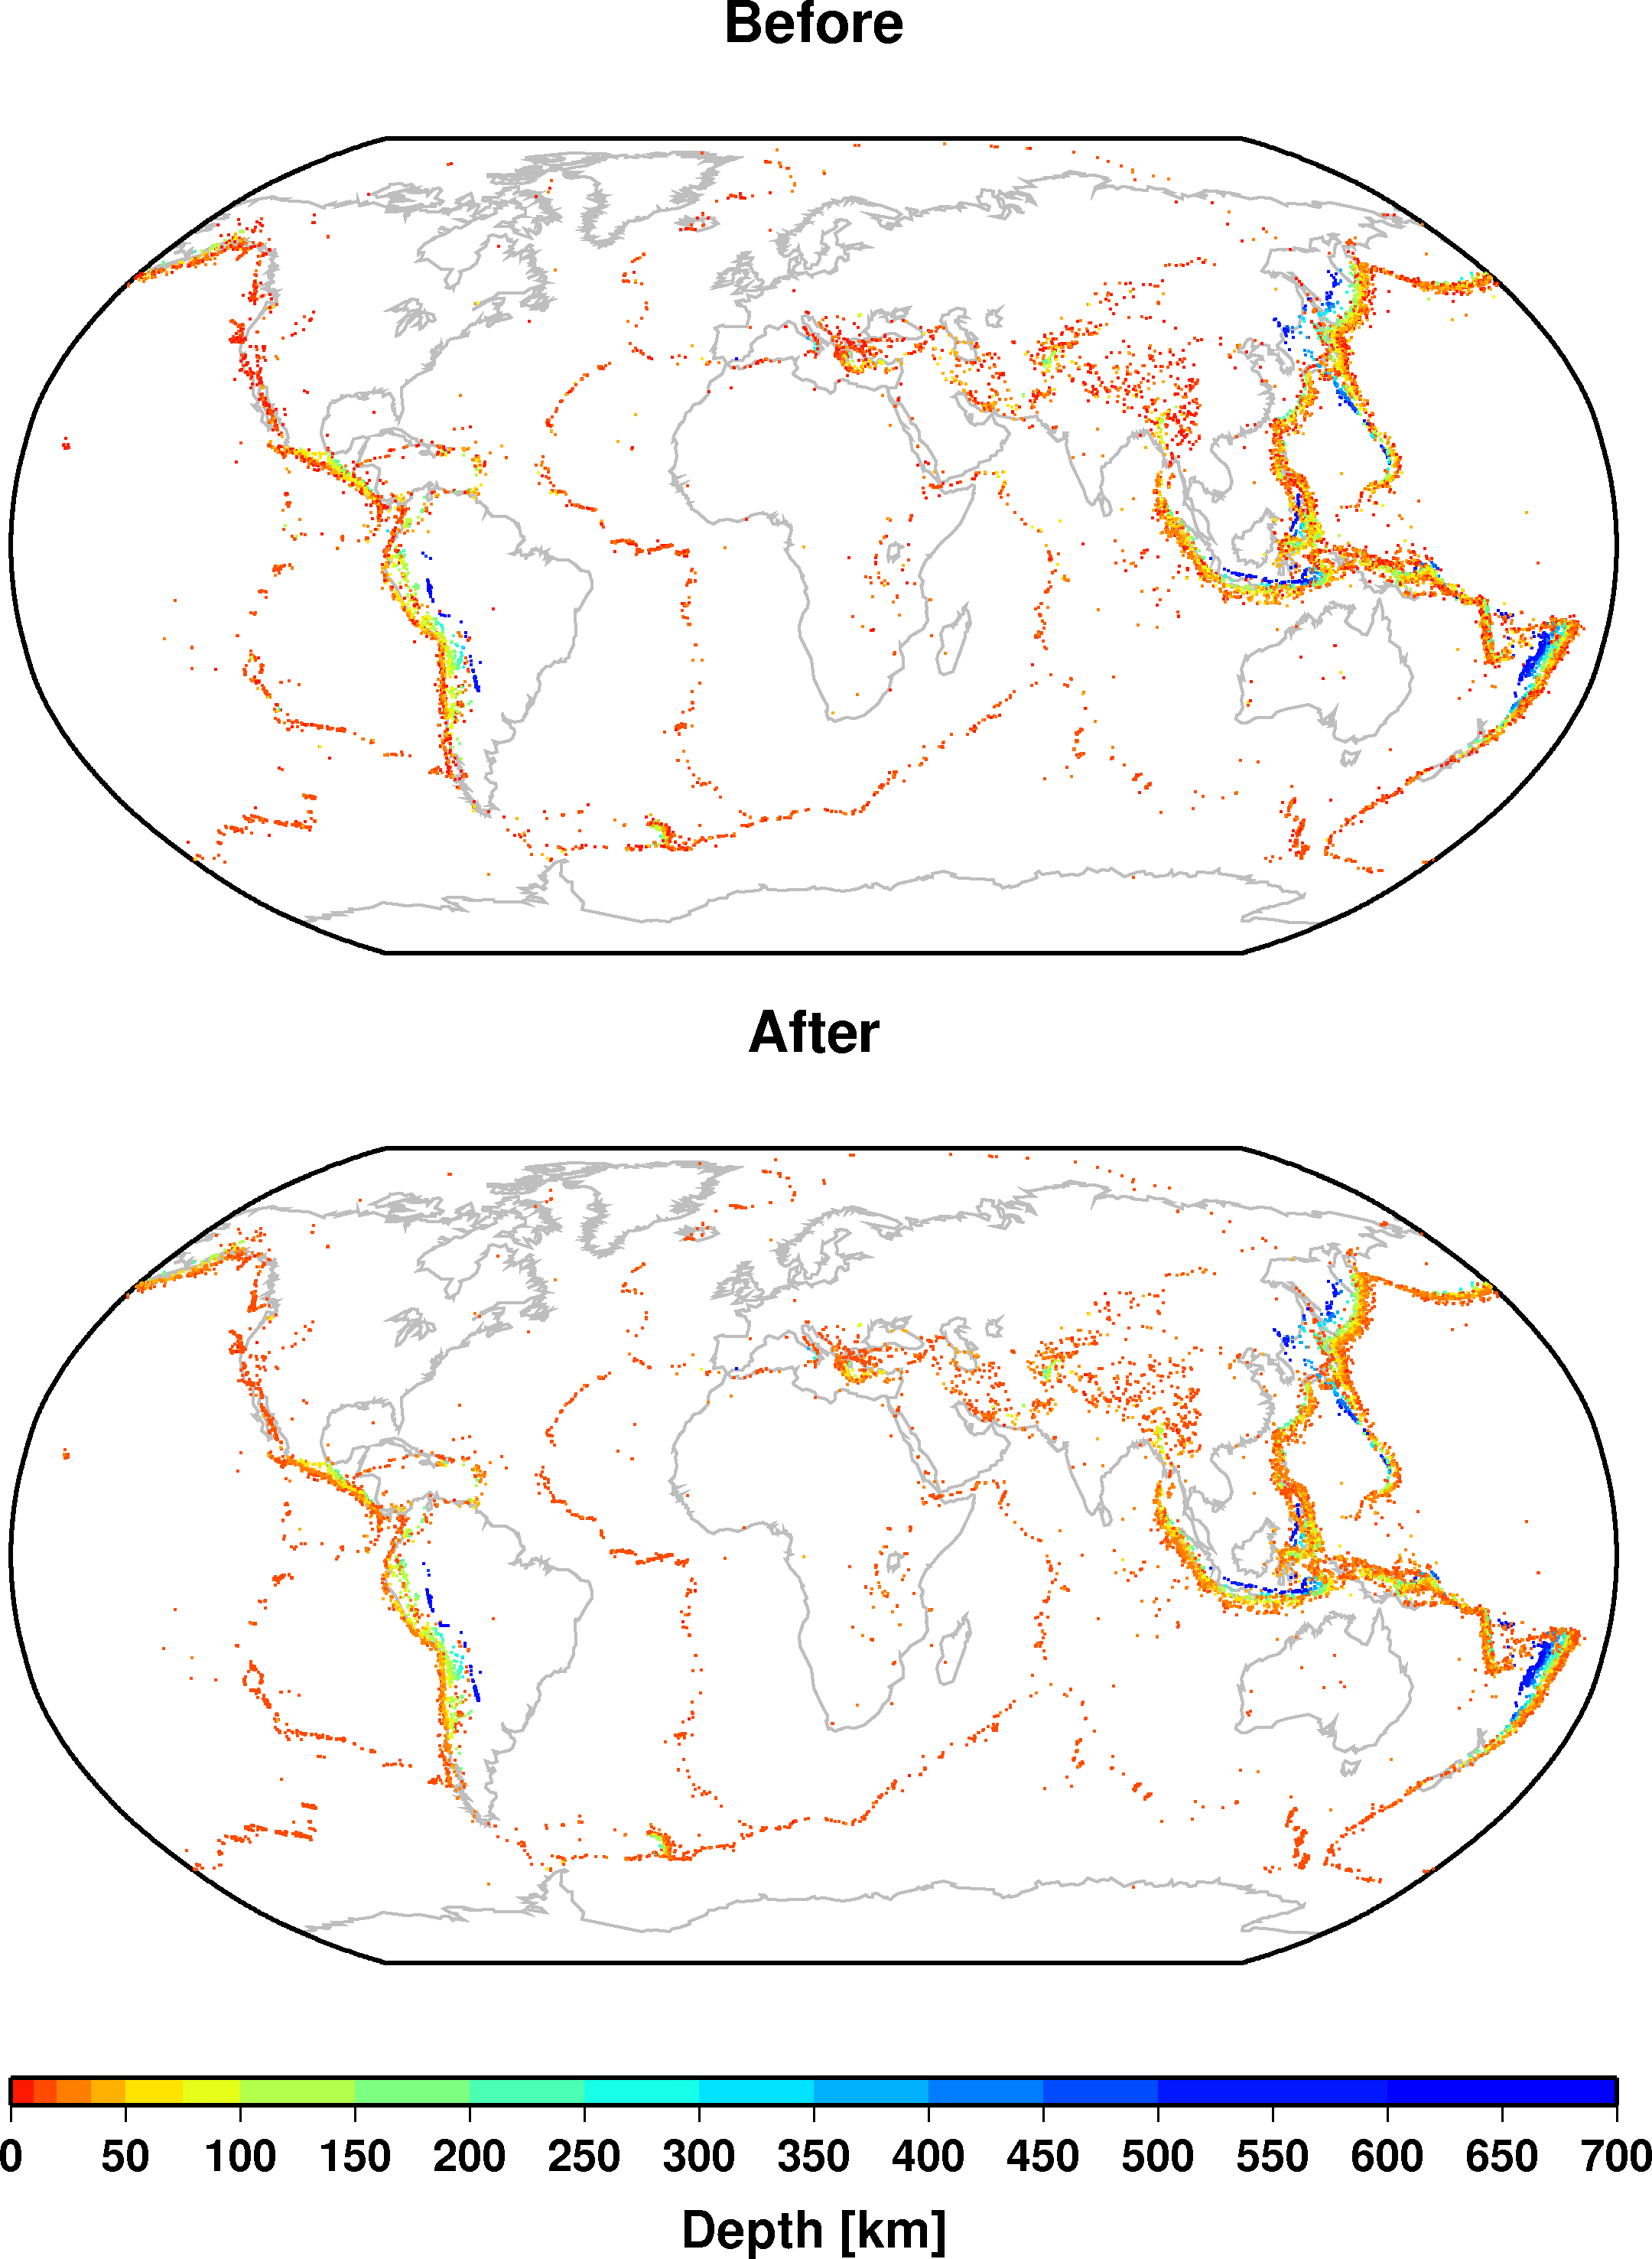
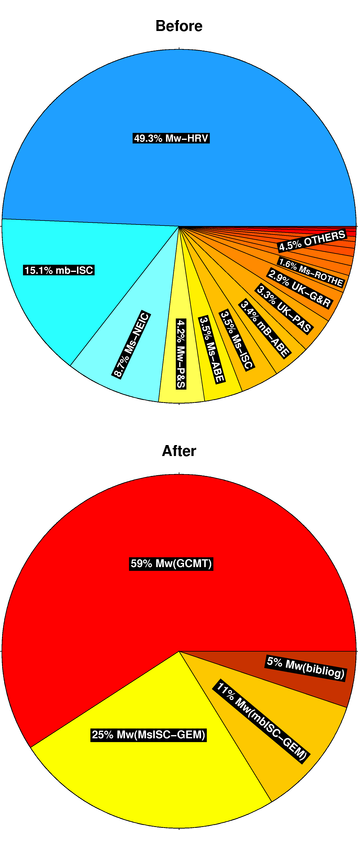
As can be seen from the Figure 2, the ISC-GEM catalogue features hypocentre solutions (after 1903) achieved by the same location technique and velocity model. It also greatly benefits from the earthquake size expressed in the same scale (Mw ) with only four approaches used to compute Mw values (Fig. 3).
|
|
|
Figure 2. The change in the view of global seismicity following the advent of the ISC-GEM Catalogue; comparisons are made against the best available solutions in the ISC database prior to the start of this project. Notably, all events in the ISC-GEM Catalogue after 1903 were relocated using the same technique and velocity model.
|
Figure 3. Improvement in homogeneity of the earthquake magnitude measurements; just four sources of MW determination in the ISC-GEM Catalogue compare favourably against a multitude of magnitude types, determination techniques and sources used in the Centennial Catalogue (Engdahl and Villaseñor, 2002).
|
Manual Data Entry
A massive effort was made to enter into the ISC database those parametric seismic data that were not electronically available (Table 1) prior to the beginning of this project:
- Arrival times, body and surface wave amplitudes and periods from the historical paper-based bulletins of high quality stations;
- Abe’s catalogue (1900-1903);
- Gutenberg Notepads (Abe’s adaptation) (1904-1917);
- BAAS Bulletin (1913-1917);
- ISS Bulletin (1918-1963);
- M0 and Mw from selected reviewed scientific literature.
 Table 1. Electronic availability of seismic parametric data prior to the start of the project.
Earthquake Relocation
We relocated every earthquake hypocentre (except a few in 1900-1903) using a two-stage process:
Stage 1: Earthquake depths are determined using the EHB technique (Engdahl, van der Hilst & Buland,1998) that features:
- a comprehensive analysis of near-event surface reflections off the earth surface inland and ocean bottom or water surface in the oceans;
- station patch corrections.
Stage 2: New ISC location algorithm (Bondár & Storchak, 2011) is used with earthquake depths fixed to those from EHB analysis:
- independent depth confirmation using depth phase stacking;
- more accurate epicentre locations due to correlated error structure taken into account (removes bias from uneven geometrical station configuration);
- all phases predicted by the ak135 velocity model are used to constrain hypocentres.
 Figure 4. An example of improvement of previous event locations in the Fiji-Tonga-Kermadec region (left) as a result of this project is seen in much tighter clustering of events (right) illuminating specific tectonic features.
Earthquake Magnitudes
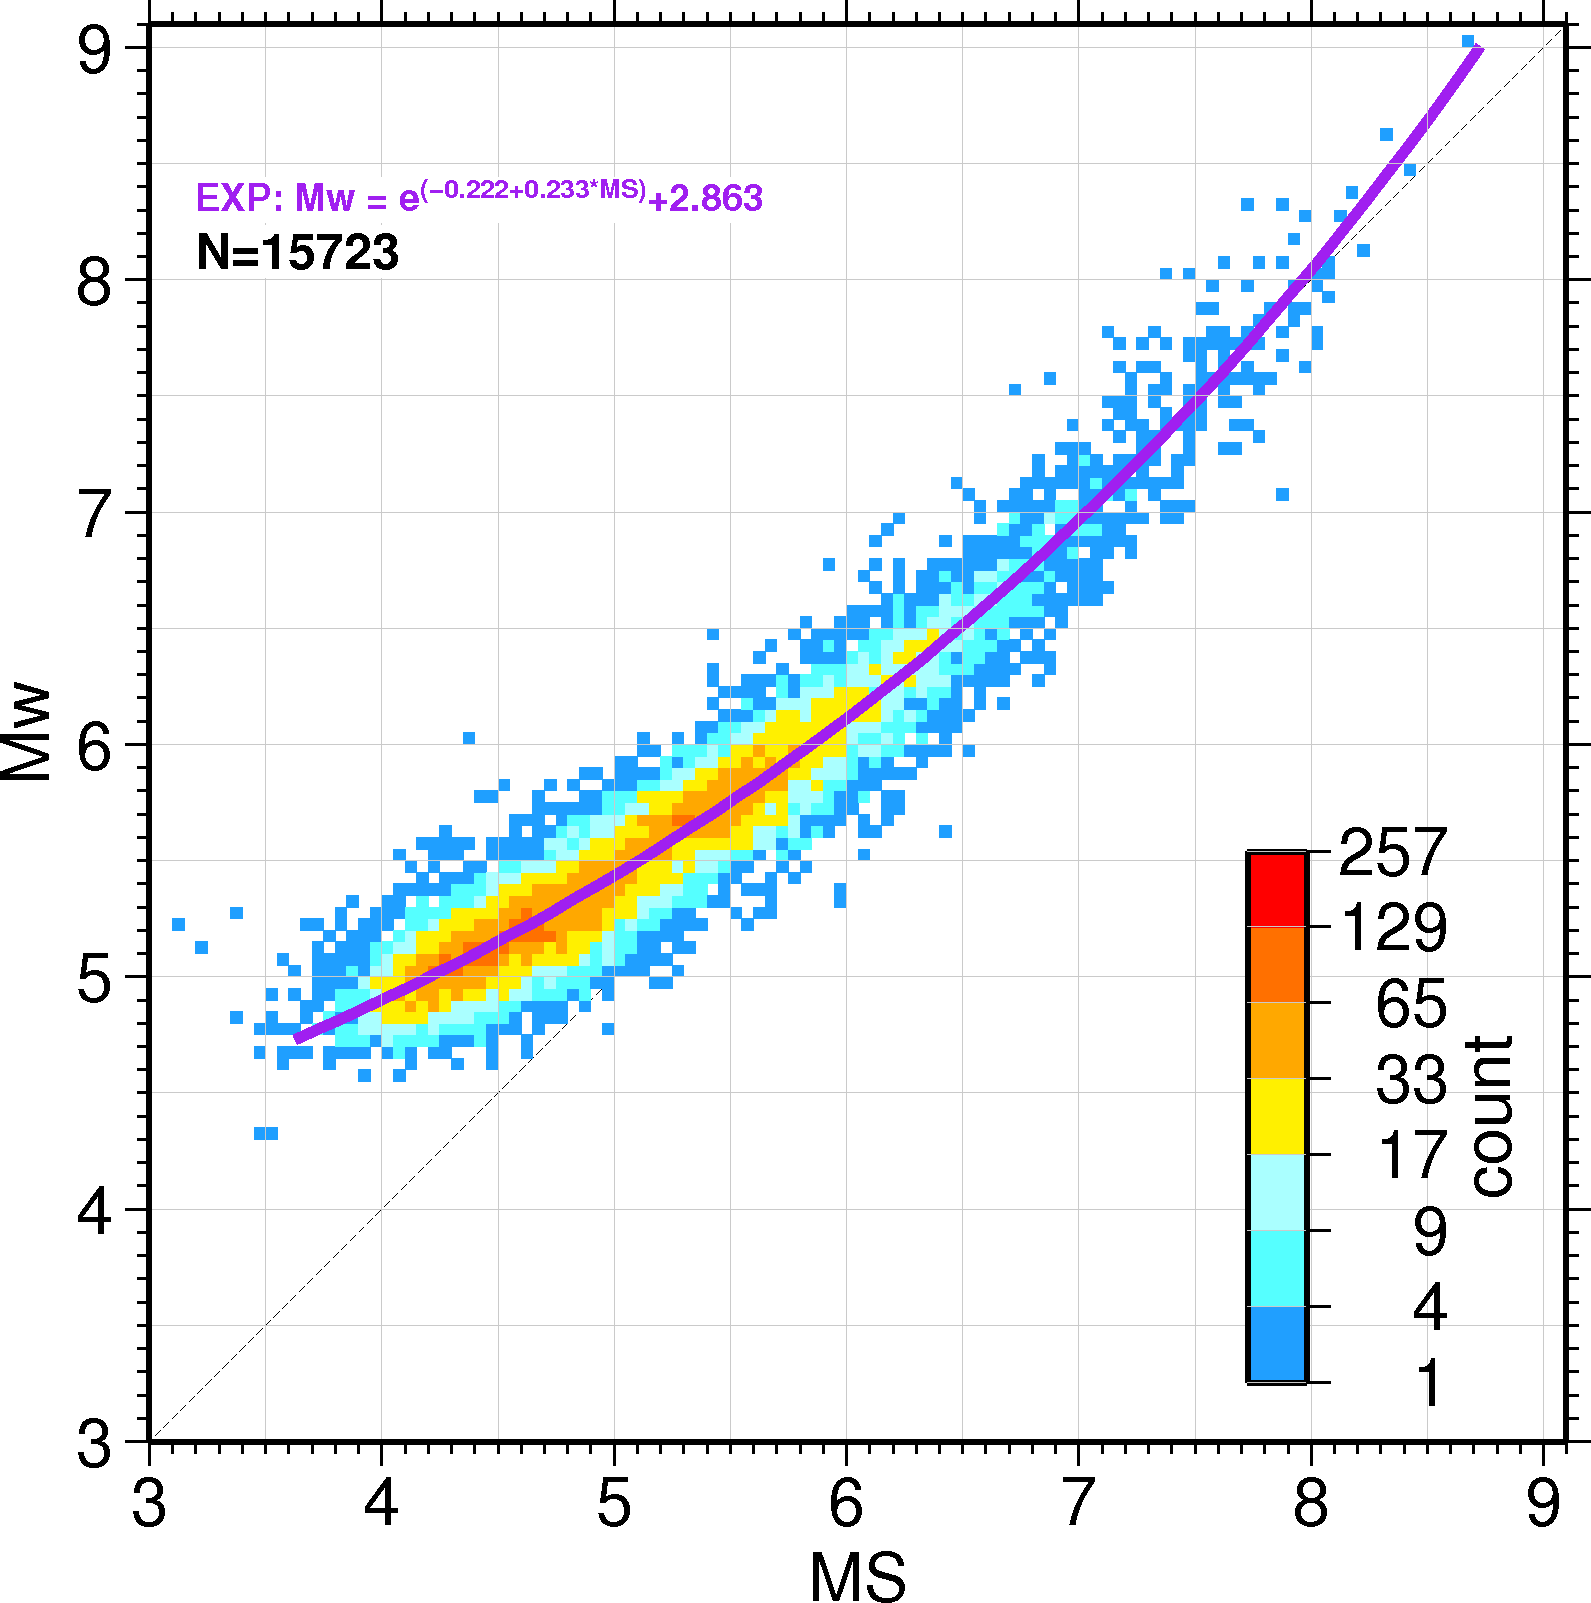 Figure 5. An Ms/Mw regression was developed during this project based on the wealth of recent GCMT Mw and ISC-GEM Ms magnitude determinations.
|
Each event in the Catalogue is characterised by a magnitude expressed in Mw scale with an uncertainty.
Where possible we used Mw based on a reliable value of seismic moment:
- GCMT (1976-2009);
- Bibliographical search of scientific articles (1900-1979) that feature a reliable estimation of M0.
Proxy Mw were used in all other cases (the majority), based on the newly developed empirical relationships (Fig. 5) with Ms and mb. All Ms and mb were re-computed using the original amplitude and period measurements.
Notably, the main source of data for the first part of the 20th century, the ISS Bulletin, does not contain amplitude measurements or magnitude estimates. We had to source those from the original paper-based station and network bulletins stored in the ISC warehouse and other collections. We used the seismic wave amplitude and period data reported by the quality seismic stations that operated for long periods of time (Fig.6).
|
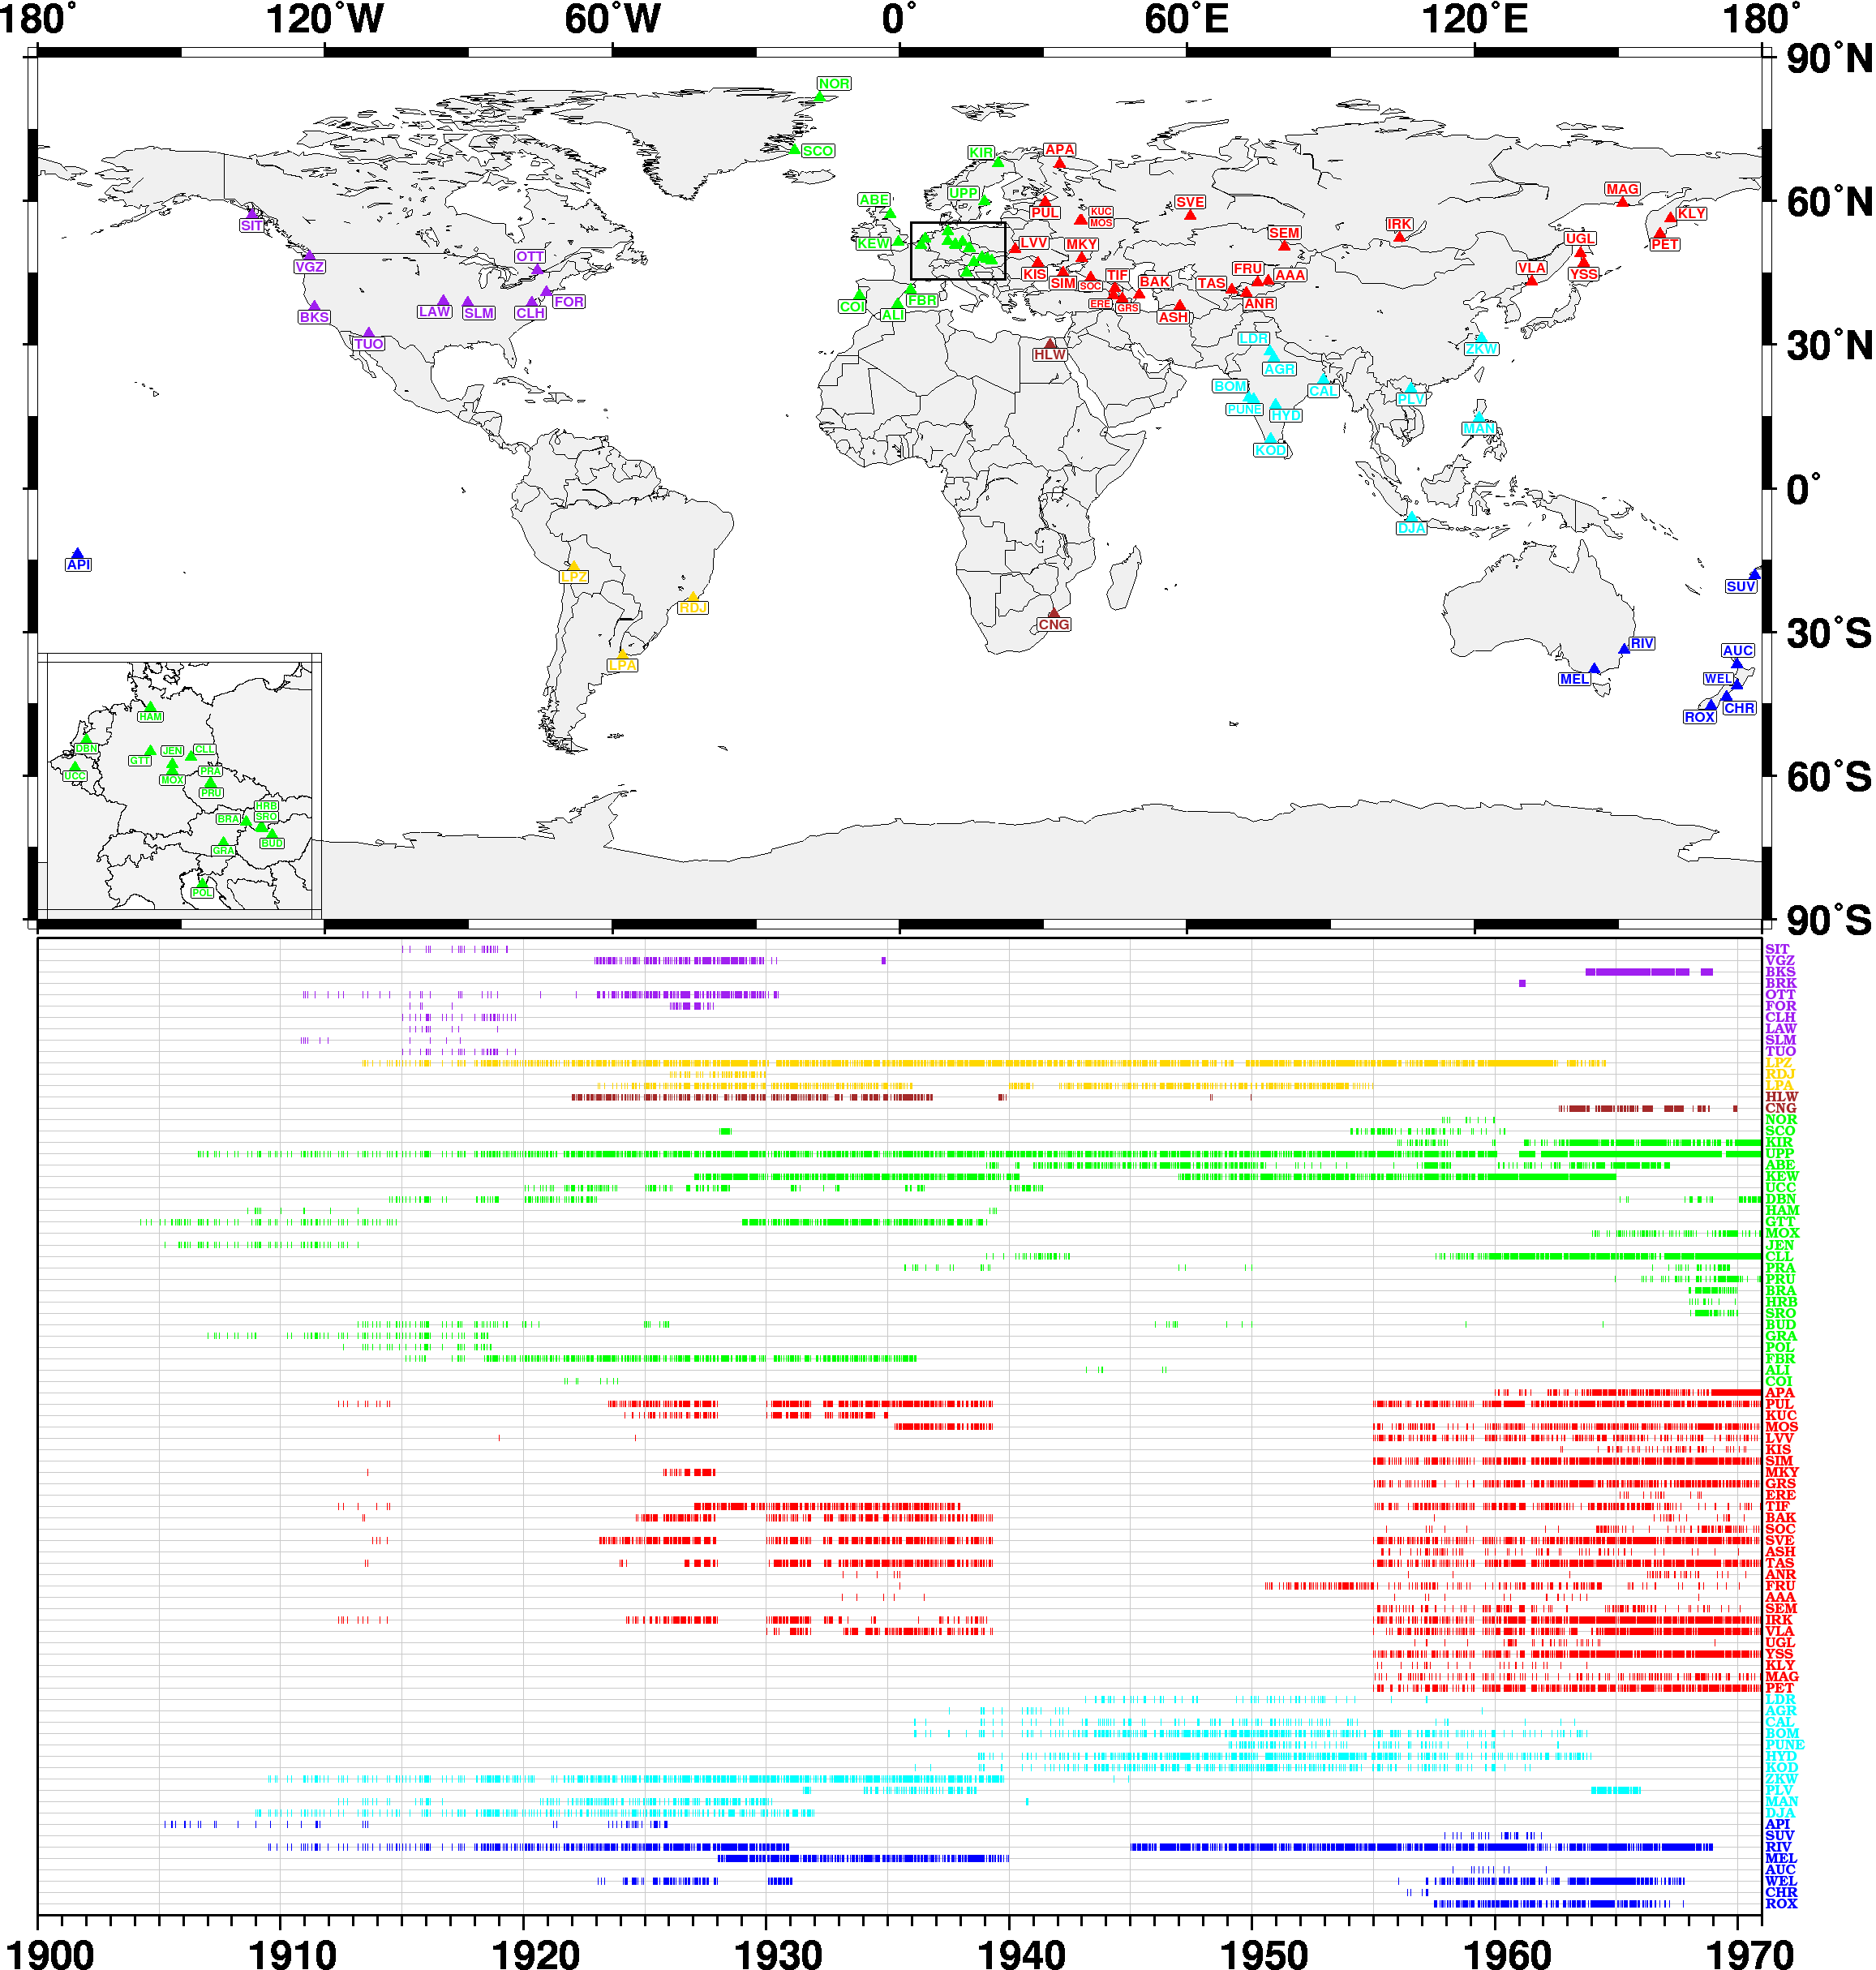 Figure 6. The map and the timeline of seismic stations for which additional data have been manually entered and used for computation of the Ms and mb magnitudes.
Overall global magnitude completeness
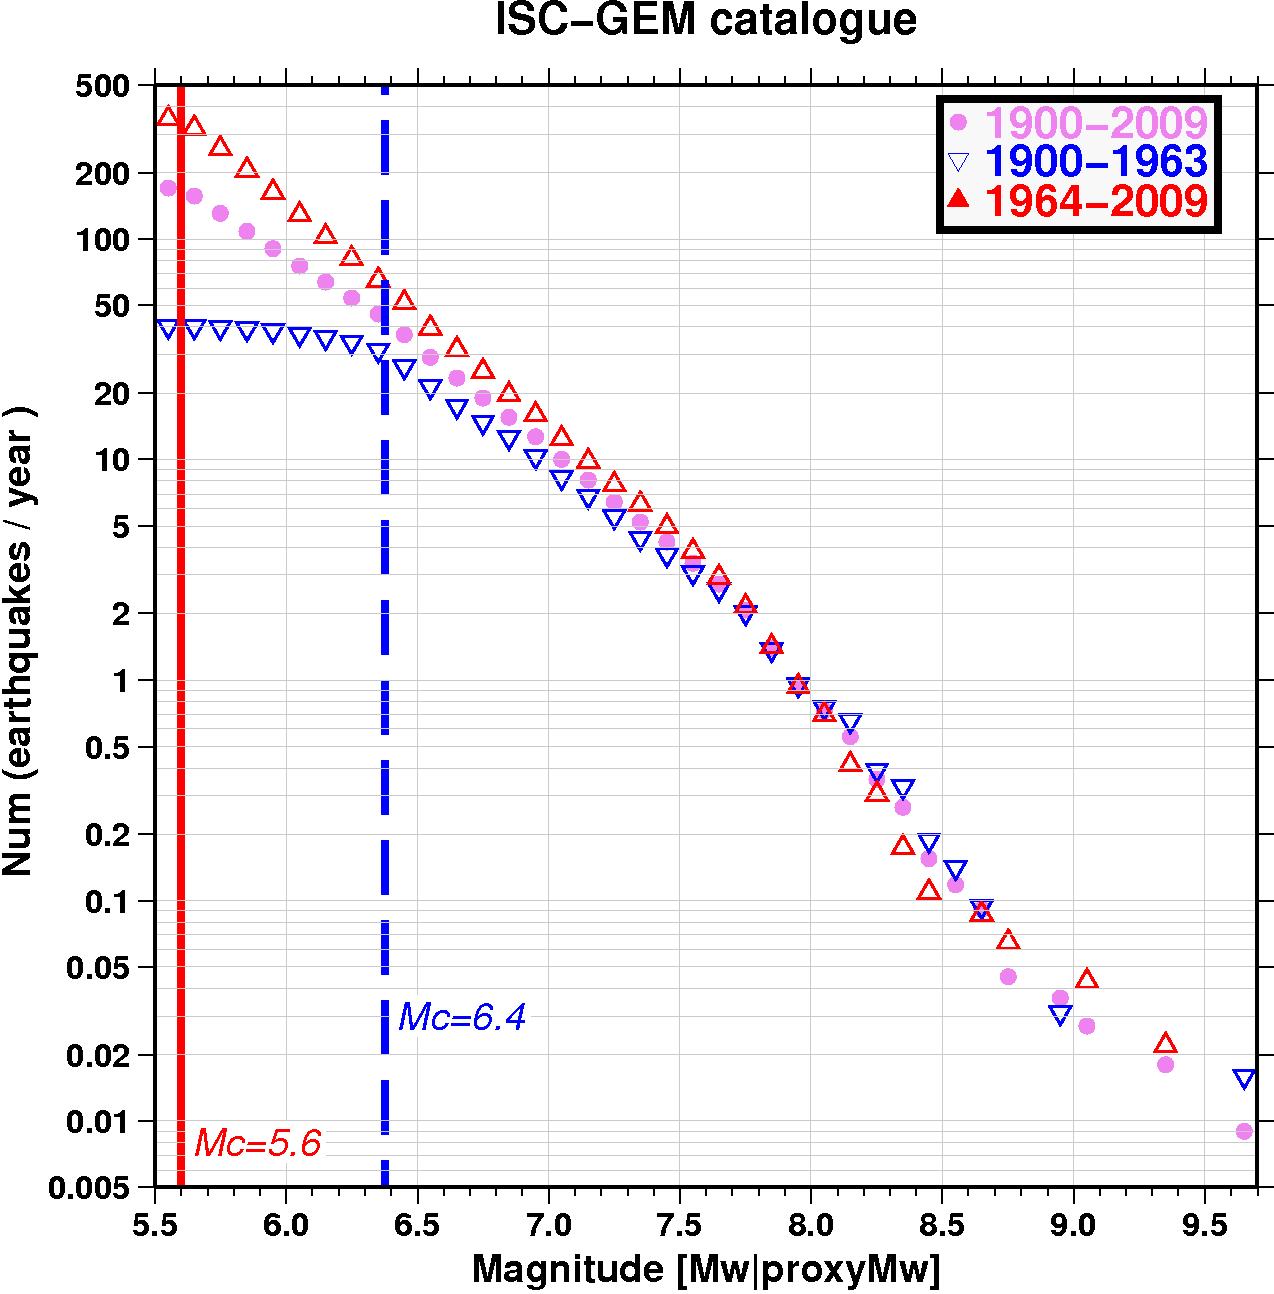 Figure 7. Magnitude frequency distribution of earthquakes in the ISC-GEM Catalogue within different periods of time.
|
Due to the comparatively small number of events in the Catalogue it is hard to assess magnitude completeness on a regional basis. On a global scale we observe a change of completeness Mc from 5.6 to 6.4 (Fig. 7) before and after 1964. This, of course, is a direct result of the change in the cut-off magnitude that, in turn, is related to the start of the ISC operations and the corresponding massive increase in parametric data availability.
Seismicity rates for large (M>7.5-7.6) earthquakes are best assessed considering the entire time window. For moderate earthquakes the modern period is a better basis for magnitude-frequency studies.
We suspect that a pronounced dip in the magnitude frequency curve at large magnitudes reflects the fact that the 110 year period is still not representative enough to account for statistics of very large earthquakes.
|
 Figure 1. Global earthquake number timeline demonstrating the effect of different cut-off magnitudes over the 110 year period; M indicates a direct or a proxy value of Mw
 Figure 1. Global earthquake number timeline demonstrating the effect of different cut-off magnitudes over the 110 year period; M indicates a direct or a proxy value of Mw
 Table 1. Electronic availability of seismic parametric data prior to the start of the project.
 Figure 4. An example of improvement of previous event locations in the Fiji-Tonga-Kermadec region (left) as a result of this project is seen in much tighter clustering of events (right) illuminating specific tectonic features.
